Loading the M-AI-R DSS…
The first load can take a few seconds. If it doesn't appear, refresh the page.

RAINREC: Climate Scenario Analysis
Analyze water balance and streamflow under different climate scenarios
Info Type:
Variable:
RAINREC: Climate Scenario Analysis
Analyze water balance and streamflow under different climate scenarios
Info Type:
Variable:
Model evaluation: Identification of model strength and weaknesses
RAINREC aims to develop an enhanced process-based rainfall-runoff modelling tool which can be used to analyse the impacts of different climate change projections and the benefits of managed aquifer recharge on catchment water availability. The tool included the development of an isotope-enabled version of the model to improve the simulation of natural groundwater recharge, as well as a pilot application in Cape Flats (Eerste River), South Africa. The second phase of RAINREC consisted of running different climate change (CC) projections using the model, utilising an external bias correction approach and the best available climate change projection resolution from the CORDEX core. The final phase consisted of running different MAR injections with different volumes and injection timing from an upstream wastewater treatment works, which had the potential for MAR application and the most sophisticated technologies in terms of purification. This required the development of a component to simulate monthly injections for the sub-basins. The different MAR scenarios were then compared to the CC projections to identify the most suitable injection volume and timing to reduce high drought risk and baseflow declines. Furthermore, injection timing was used to reduce the potential of flood risk during the wet period.
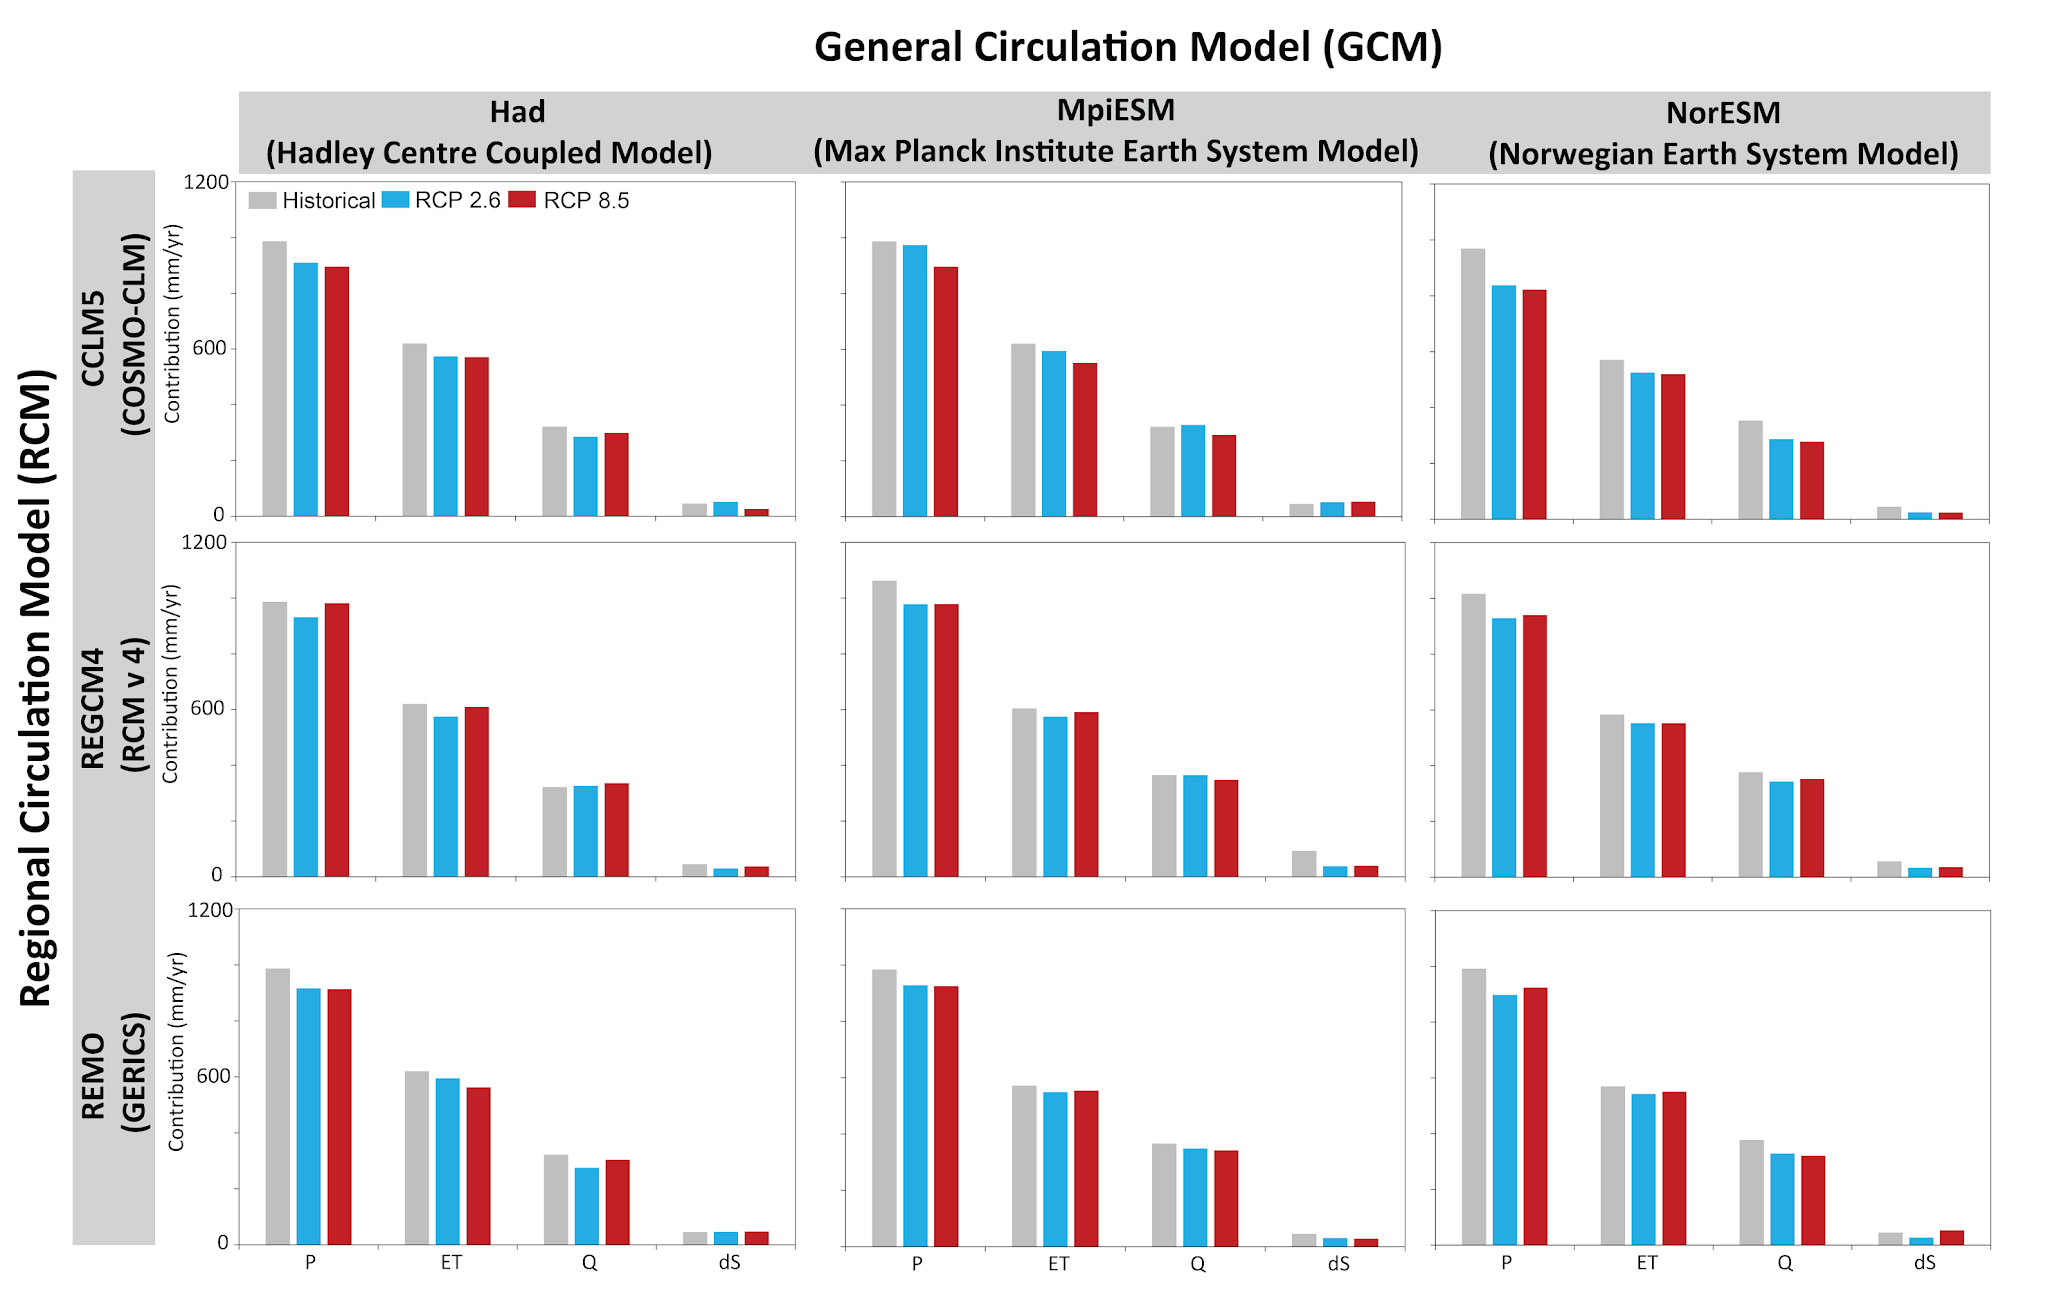
Future Projections - Water Balance
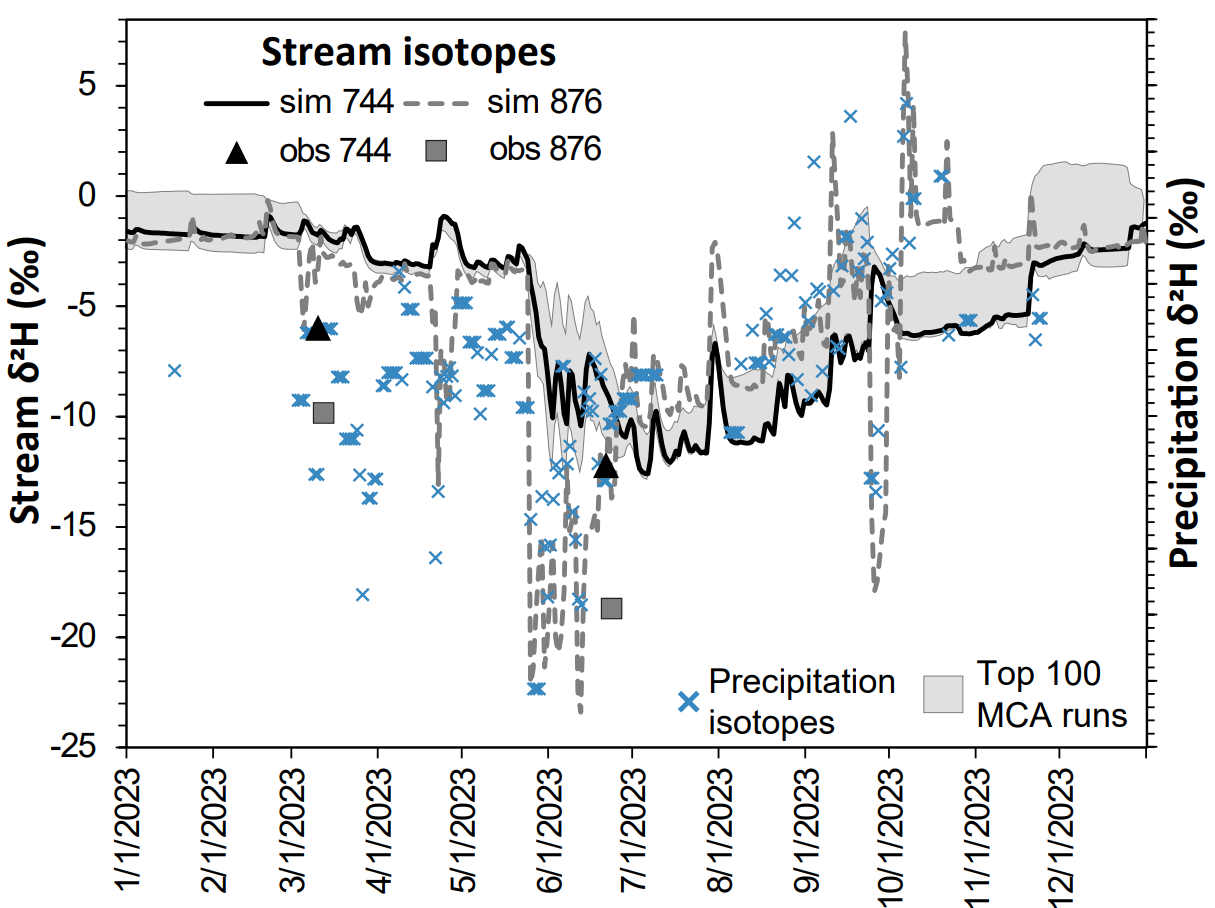
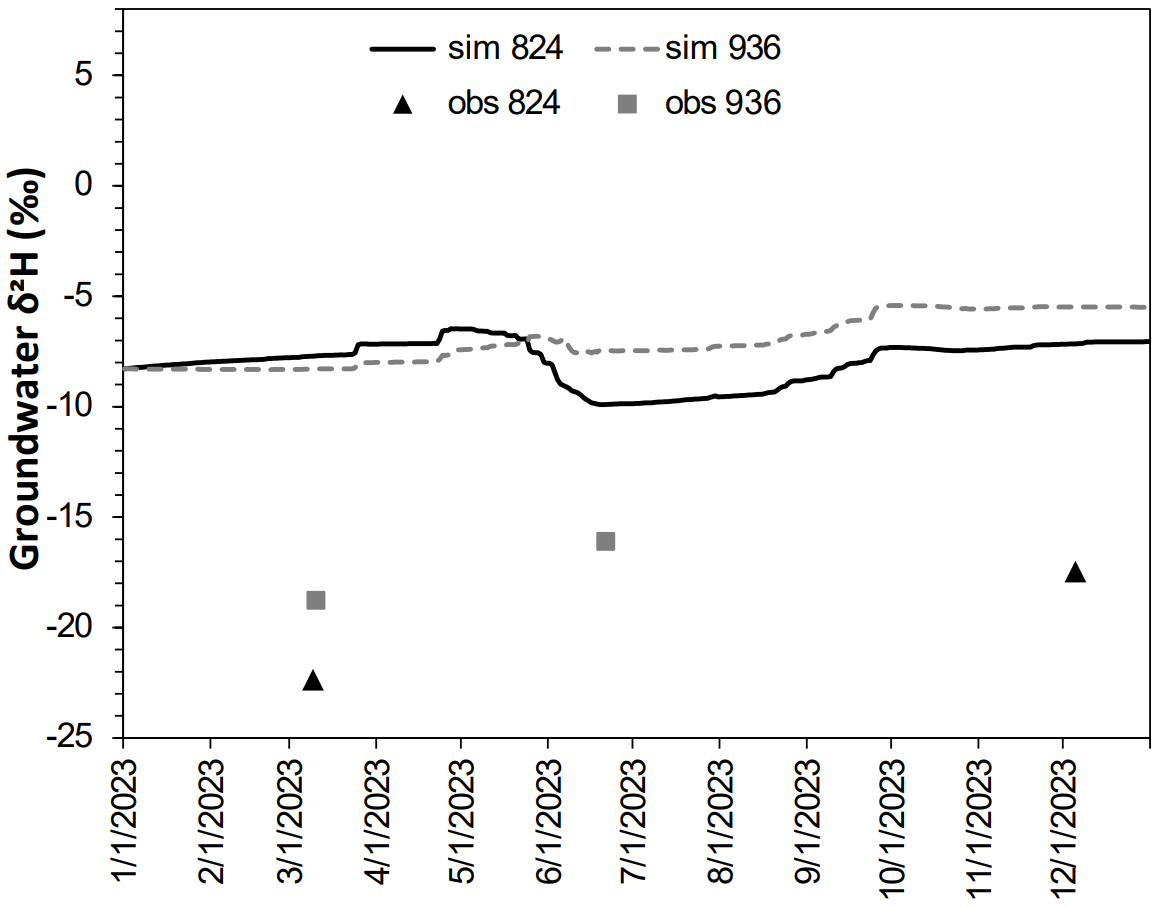
Rainrec was able to simulate stream isotopes (2H) for the main channel within the basin but struggled to reproduce stream isotopes for small sub-basins and streams. This can mainly be associated to the input precipitation isotope data and the bias in the isotope-enabled climate model results, which we used as inputs to Rainrec.
About RAINREC Model
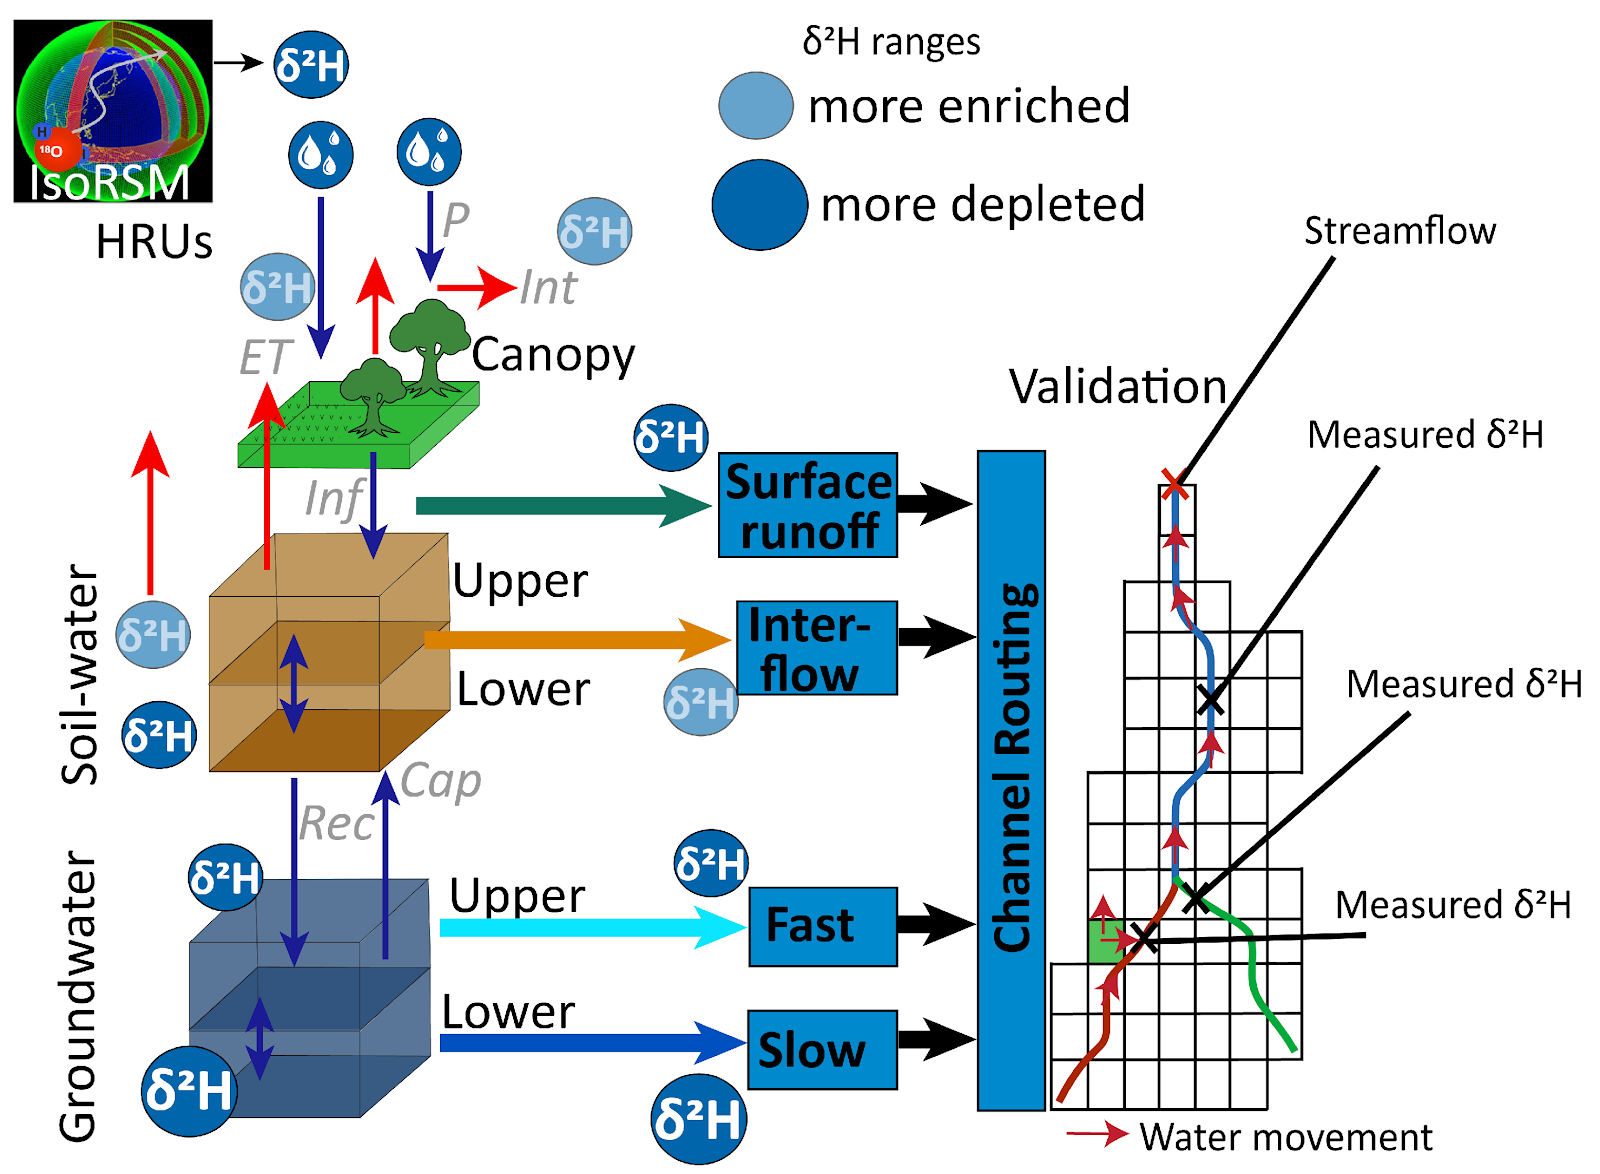
In this project we show how the isotope-enabled rainfall-runoff model identified the strengths and weaknesses of the site application, including the ability to simulate flow components (surface runoff, interflow, baseflow). In simple terms the model tracks and simulates both water volume together with stable water isotope compositions (2H and 18O). Stable water isotopes are only affected by phase change (i.e., liquid to gas, solid to liquid) and mixing with different sources, therefore excellent tools for tracing water movement within the hydrological cycle. Here we show a simplified schematic of 1 hydrological response unit (of which the model includes many) and show where (from different model components) the isotopes are simulated and then how we include measured isotopes of river, precipitation and groundwater to validate and calibrate the model.
Model Evaluation
Rainrec was able to simulate stream isotopes (2H) for the main channel within the basin but struggled to reproduce stream isotopes for small sub-basins and streams. This can mainly be associated to the input precipitation isotope data and the bias in the isotope-enabled climate model results, which we used as inputs to Rainrec.
Streamflow Evaluation
Groundwater Evaluation
Spatial Distribution of Water Balance Components
Here we show firstly in the map the average simulated sub-basin isotope value which contributes to the stream. More negative value suggest more isotope depletion where streamflow is derived from precipitation of colder temperature, high latitudes or inland positions. More positive values suggest more isotope enrichment where processes like evaporation has occurred. We do not show the model performance for streamflow (volumes) but these are available in Evaluating input data sources for isotope-enabled rainfall-runoff models. The Kling Gupta efficiency was used to evaluate the simulated stream isotopes compared to measured stream isotopes.
Evapotranspiration
Percolation
Soil Moisture
Evaluation Results
The first among the above maps illustrates the simulated evapotranspiration (ET) and its significant impact on the total water balance, comparing different calibration strategies and the influence of various input data sets as detailed in the published article. Due to the inherent dryness of the study area, there is a high evaporation potential; however, the headwaters demonstrate a high overall ET simulation specifically because of the greater availability of moisture in those locations. Regarding the simulation of percolation, the study compares results across diverse model calibration strategies, noting an overestimation of percolation attributed to the challenges in constraining episodic recharge. This specific difficulty highlights a general and recognized technical limitation currently faced by rainfall-runoff modelling approaches on a global scale. Finally, the analysis of soil moisture simulation indicates that the model successfully captures both dynamics and variability across the tested calibration strategies. While the results were not validated against measured data due to specific data constraints, other applications of the model have consistently shown good general simulation trends and an effective capture of climate variability."
Technical Details
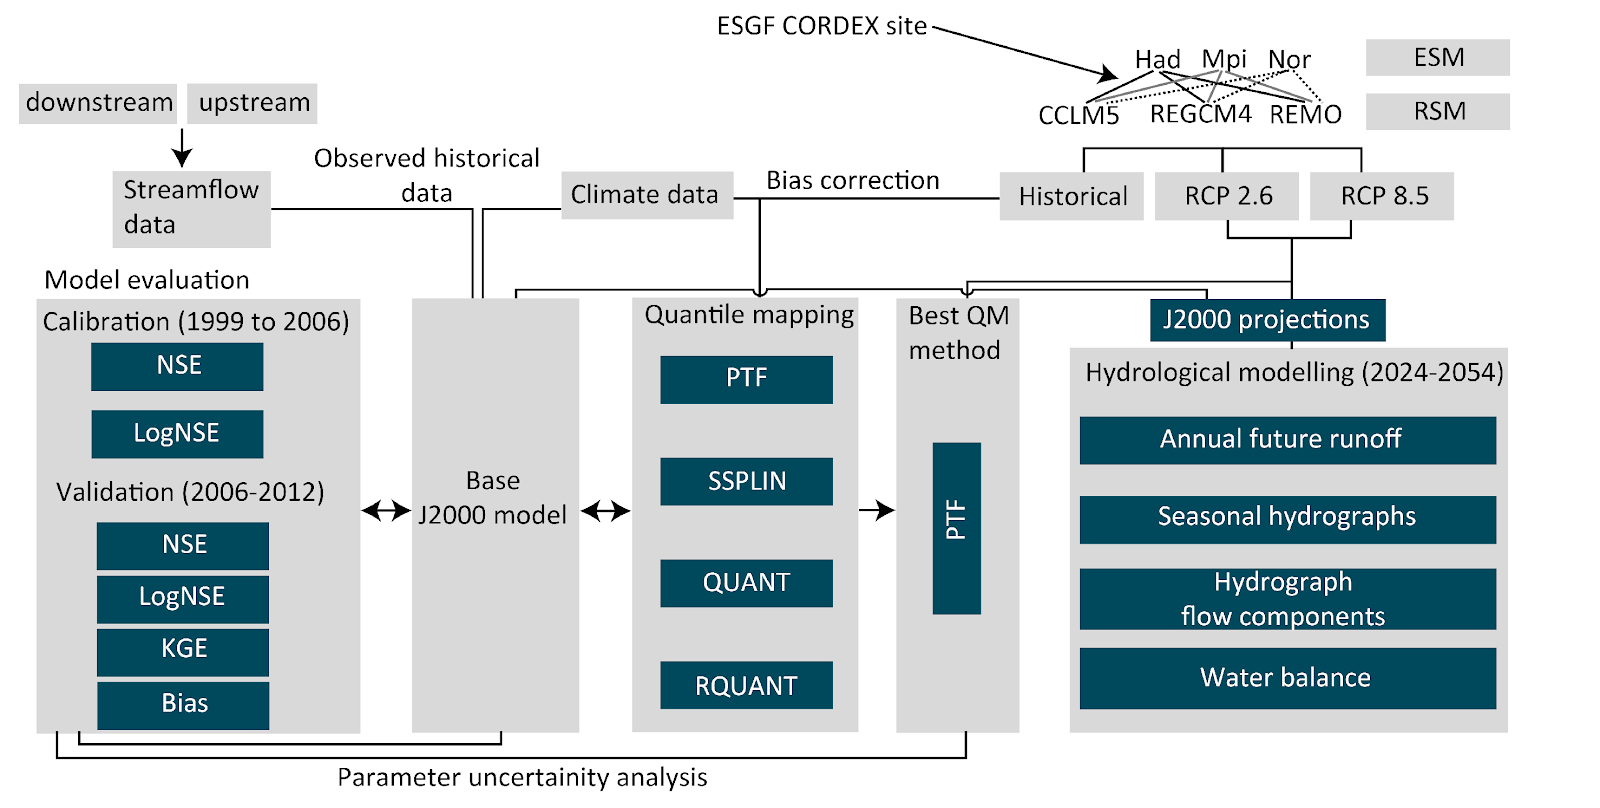
Whilst we evaluate the model process simulation using simulations of stable water isotopes, we likewise evaluate whether the historical simulations of the future projections are able to recreate observed conditions at the catchment. Namely observed streamflow for an upstream and downstream streamflow gauge (where streamflow gauging structures exists). Here we show the workflow diagram showing the processes of data collection from ESGF (Earth System Grid Federation), bias correction using quantile mapping of projections (PTF: parametric transformation, SSPLIN: smoothing splines, QUANT: empirical quantile, RQUANT: robust empirical quantile), data used in the development of a base hydrological model with calibration and validation criteria (Nash Sutcliff Efficiency in standard form: NSE; Nash, 1970, logarithmic form: logNSE, the Kling Gupta Efficiency: KGE, Gupta et al., 2009 and Bias) and the analysis of near future hydrological projections and parameter uncertainty. The different projections include Earth System Models: Hadley Centre (Had), Max Planck Institute for Meteorology (MPI), Norwegian Earth System Model (Nor) as well as Regional Spectral Models: COSMO-CLM version 5 (CCLM5), Regional Climate Model version 4 (RegCM4), Regional Model developed at the Max Planck Institute for Meteorology (REMO) for both a Representative Concentration Pathways (RCP) of 2.6 (conservative) and 8.5 (extreme) warming scenario.
If you'd like to learn more about this topic, feel free to check out the following links to scientific papers from the MAR2PROTECT team.
Scientific References
Evaluating input data sources for isotope-enabled rainfall-runoff models
Advancing isotope-enabled hydrological modelling for ungauged calibration of data-scarce humid tropical catchments
Assessing inter-basin groundwater input to the Verlorenvlei estuarine lake using stable isotopes and hydrochemistry
Demystifying the art of isotope-enabled hydrological and climate modelling

Built with Reflex